| Name | curveDetail |
||
|---|---|---|---|
| Examples |
settings <- function() {
size(100, 100, P3D)
}
setup <- function() {
noFill()
noLoop()
}
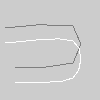
draw <- function() {
curveDetail(1)
drawCurves(-15)
stroke(126)
curveDetail(2)
drawCurves(0)
stroke(255)
curveDetail(4)
drawCurves(15)
}
drawCurves <- function(y) {
curve(5, 28 + y, 5, 28 + y, 73, 26 + y, 73, 63 + y)
curve(5, 28 + y, 73, 26 + y, 73, 63 + y, 15, 67 + y)
curve(73, 26 + y, 73, 63 + y, 15, 67 + y, 15, 67 + y)
}
| ||
| Description | Sets the resolution at which curves display. The default value is 20. This function is only useful when using the P3D renderer as the default P2D renderer does not use this information. | ||
| Syntax | curveDetail( | ||
| Parameters |
| ||
| Related |
curve curveVertex curveTightness |
